January 1, 2016
Knowing the true costs of your growing strategy is essential for determining your pricing.
Systemized production costs
A rose grower applies activity-based accounting, to understand true costs of his products
BY JOEL SCHRAVEN
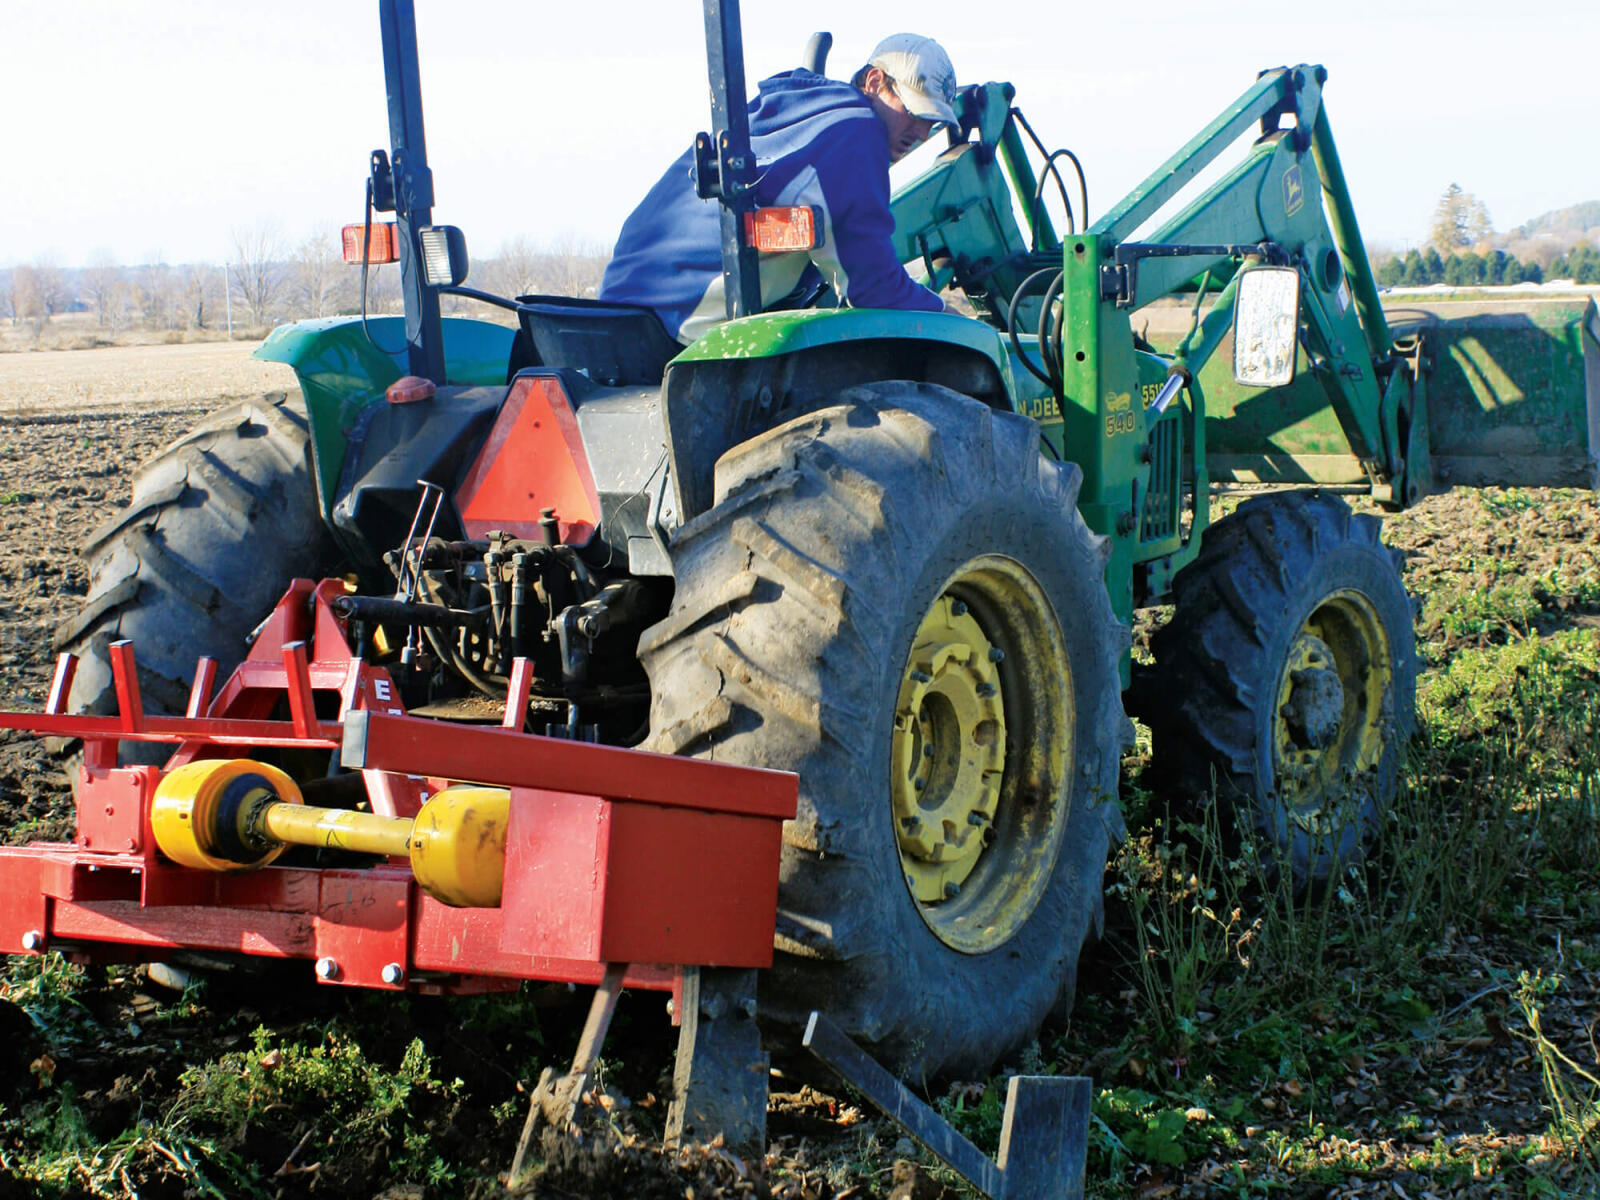
Not long after I finished high school and started full time in our nursery, my father sent me out to the sales yard to price some upright junipers we had dug over the previous few days. Standing amongst the Skyrockets and Mountbattens, he handed me a list, a yardstick, and a pencil. Next to the botanical name there were columns with a variety of heights with a wholesale and retail price adjacent to where I was to record the quantity of each.
Eager to learn I asked dad, “How did you come up with the prices?”
“I looked in Neil’s (Connon NVK) catalog and got the wholesale price and doubled it for the retail.” he replied.
Though I didn’t think of it at the time, I am now 100 per cent certain that our costs of production for those plants were not the same as they were at Connon Nurseries. Your pricing and production decisions need to be based on conditions present in your business. To make the right decisions you need to know what your true costs are.
You know how much labour costs are for a full day of action by your potting crew. You know how many finished plants they turn out, and how many containers, and how much potting mix they used. These are direct expenses and are the basis of establishing the cost of production. But how much overhead do you attribute to that potting activity? How much fuel, maintenance and depreciation were attributed to the loader that filled the hopper or the tractor that towed the trailers to the hoop houses? How about office administration? The selling price of those plants has to recoup these costs (in many cases — several years’ worth) as well as provide a profit.
Determining your true cost of production is a complex issue, and its analysis will require time and commitment, but it is worth the effort for every business. For example, the activity-based accounting (ABC) system was introduced in 1988 by Robin Cooper and Robert S. Kaplan in response to the needs of manufacturers to track their costs in an increasingly complex and competitive business environment. As an aspect of management accounting, ABC was conceived as a means of associating overheads to complete production processes. The original article by Robin Cooper and Robert Kaplan, Measure Costs Right: Make the Right Decisions is available online, and provides an excellent introduction to the concept.
Components of ABC
The essential premise of the ABC model is that costs are reallocated proportionally from the general-ledger accounts based on the actions that make up a process to create a product or other output of the firm. The model follows a two-stage approach to assign costs to the cost objects based on resources and activities.In the first stage, overhead costs or resources, as recorded in general ledger accounts, are distributed to predetermined activities in rates determined by the resource driver. The newly aggregated costs are now charged to cost objects using activity drivers.
Resources are expenses that are identified from the chart of accounts and represent the capacity to perform work. Let’s say you are running your potting machine. It consumes electricity, maintenance labour and materials, and both the machine and structure are depreciated yearly. All these items can be combined to become a resource which can be allocated proportionally through a resource driver. To do so means that you have to disaggregate the appropriate amounts from the general ledger accounts to assign a value to the resource.
Resource drivers are a measure of the quantity of resources consumed by an activity. They are expressed as measurable units such as square meters of floor space, gallons, or with the example of the potting machine above — machine operating hours.
The second stage is creating the activities. This is the most difficult aspect of developing an ABC system, but using the information gathered through the creation of a process map makes it easier.
Activities are tasks grouped together to perform a function that are governed by the same driver and same level of resource consumption. They determine how labour hours are used to perform the activities, which resources are required and the value of the activities to the organization.
The more detailed the list of activities, the more complicated and expensive the system will be to implement and maintain, so multiple actions should be aggregated into a single activity. For example, a “shipping activity” may include document preparation time, packaging and packing, and loading, but because a grower likely handles multiple sizes or formats of products they may need multiple shipping activities such as bare-root shipping and balled-and-burlapped shipping.
There is a practical limit to how many resources or actions can be aggregated to an activity, because at some point the ability of a driver to accurately trace the resources utilized decreases.
Activity drivers are a factor used to assign cost from an activity to a cost object, or the quantity of the activity used in the creation of the cost object. In the shipping activity mentioned above the driver could be linear meters of loaded trailer, 10 meters bare root, 20 meters two- to five-gallon, five-meter balled and burlapped, with each plant format being an activity to reflect different resource consumption.
Developing an ABC model
The first step of an ABC analysis, therefore, is to choose what to analyze, and to analyze what matters, so choose a product you believe to be an important part of your offerings.Next you need to develop a detailed process map or flowchart. These are a visual representation of all the activities (in sequence) that are performed in a work process. They include material and labour hour inputs and a timeline.
To begin the analysis direct costs such as labour, materials and equipment are applied to each stage. To establish an hourly equipment cost, gather appropriate amounts from the expense accounts. These will include depreciation/amortization, fuel, equipment maintenance, and loan interest to arrive at a total yearly cost for the piece of equipment. Then you need to calculate the hourly cost by dividing this figure by the hours the machine worked.
Creating resources and resource drivers
Resource pools are defined by the driver.RESOURCE POOL DRIVER
Machine use resource machine hours
Employment resource labour hour
Administration resource transactions
Facility cost resource square meters
Vehicle use resource kilometers travelled
In this example the other expenses are gathered into a business-sustaining cost object. A final cost object gathers costs that are not allocated to a process but can be applied later. In most cases these amounts should be small enough so as not to be significant, otherwise they should be reexamined and allocated to a resource pool.
Creating activities and activity drivers
Using the tasks from the process map and by reviewing the direct costs, resources can be associated with each task that consumes similar types of direct costs. These can be grouped to create ABC activities:Clean, grade and prepare for planting
Permanent labour Direct cost Employment Resource
Facility cost Resource
Apply fertilizer and herbicide and till field
Management labour Direct cost Equipment costs Direct cost Fertilizer and herbicide Direct cost Machine cost Direct cost
Machine use Resource Employment Resource Vehicle use Resource
Administration Resource
Plant field
Understock Direct cost
Permanent labour Direct cost Management labour Direct cost Machine cost Direct cost Employment Resource
Machine use Resource
By associating the activities with the resources consumed, unique ABC activities (collection of resources plus direct costs) are identified that are involved in the production of a field of roses.
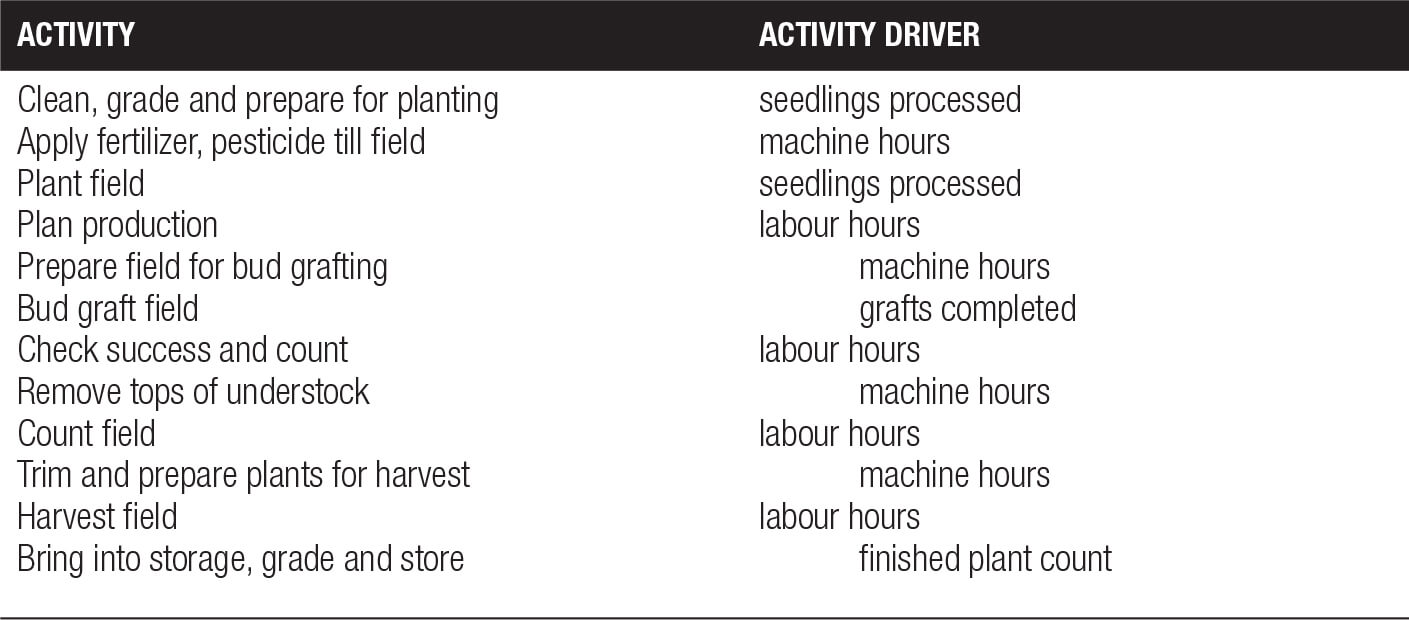
To flow the costs of these activities to cost objects, in this case a bare root rose plant, an appropriate driver must be chosen. Reviewing the nature of the costs and resources provides answers for choosing Activity Drivers. The chart above lists the proposed drivers for each activity.
This illustrates the total cost of the cost object (rose bush) at each stage of production.
This production process is now finished and there are two cost objects. One is business sustaining and the other is the finished plant, ready to use. At this point the plant may be sold as is, or placed for sale later in the season.
The business-sustaining cost object could be allocated at this point on a per unit basis. This would be calculated based on the percentage of total revenue of the firm the product represents and should be accumulated over the entire production process if it takes place over multiple periods. This is likely an imperfect solution, but it will allocate sustaining costs to a product and ensures that all expense amounts are accounted for.
Joel Schraven is the owner of Pickering Nurseries in Ontario.